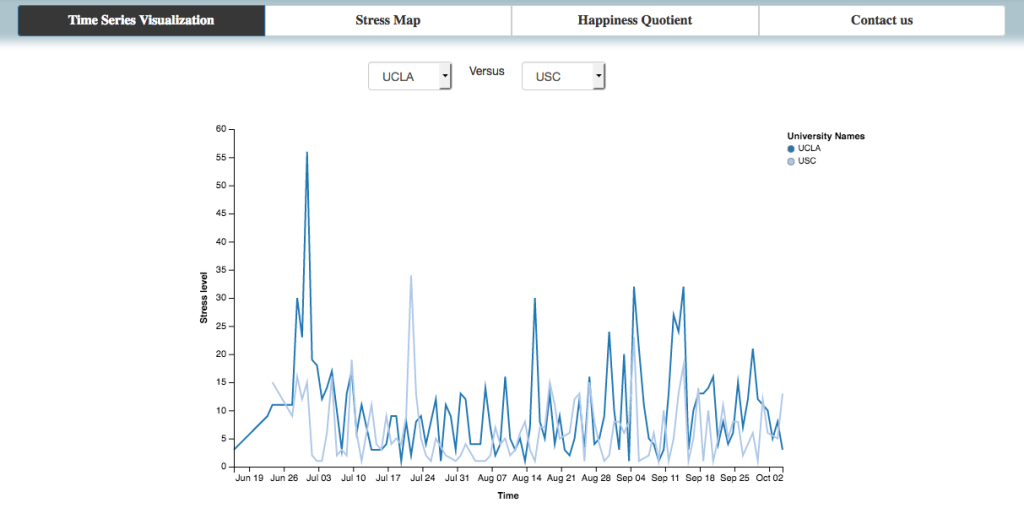
UCIPT has developed a visualization application that compares social media data from 10 different universities. Each day tweets are collected and the graph is updated, providing trends and insights into the real-time stress and happiness quotients at these institutions.
Click here to view a demo of the application.
For more information, please contact us at info@predictiontechnology.ucla.edu.